Convex Usage Page Problem
🪲Bug Report📊Dashboard
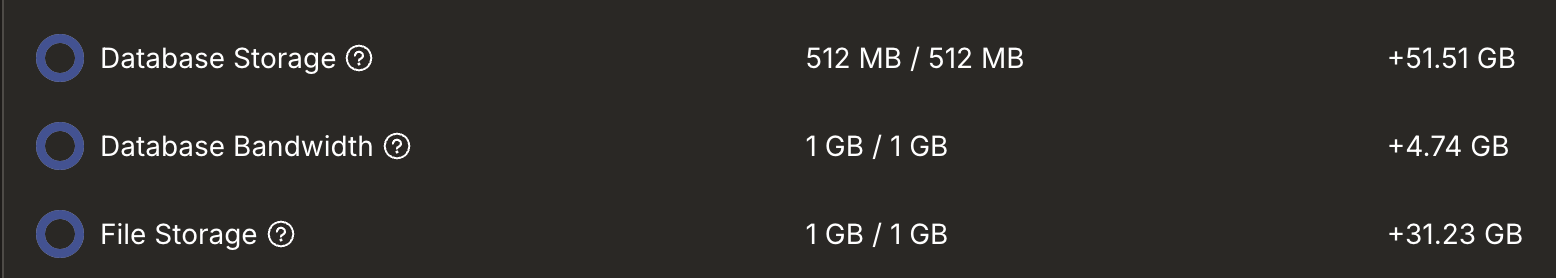
My usage page in convex says I've used 50GB of data storage in the last 6 days.
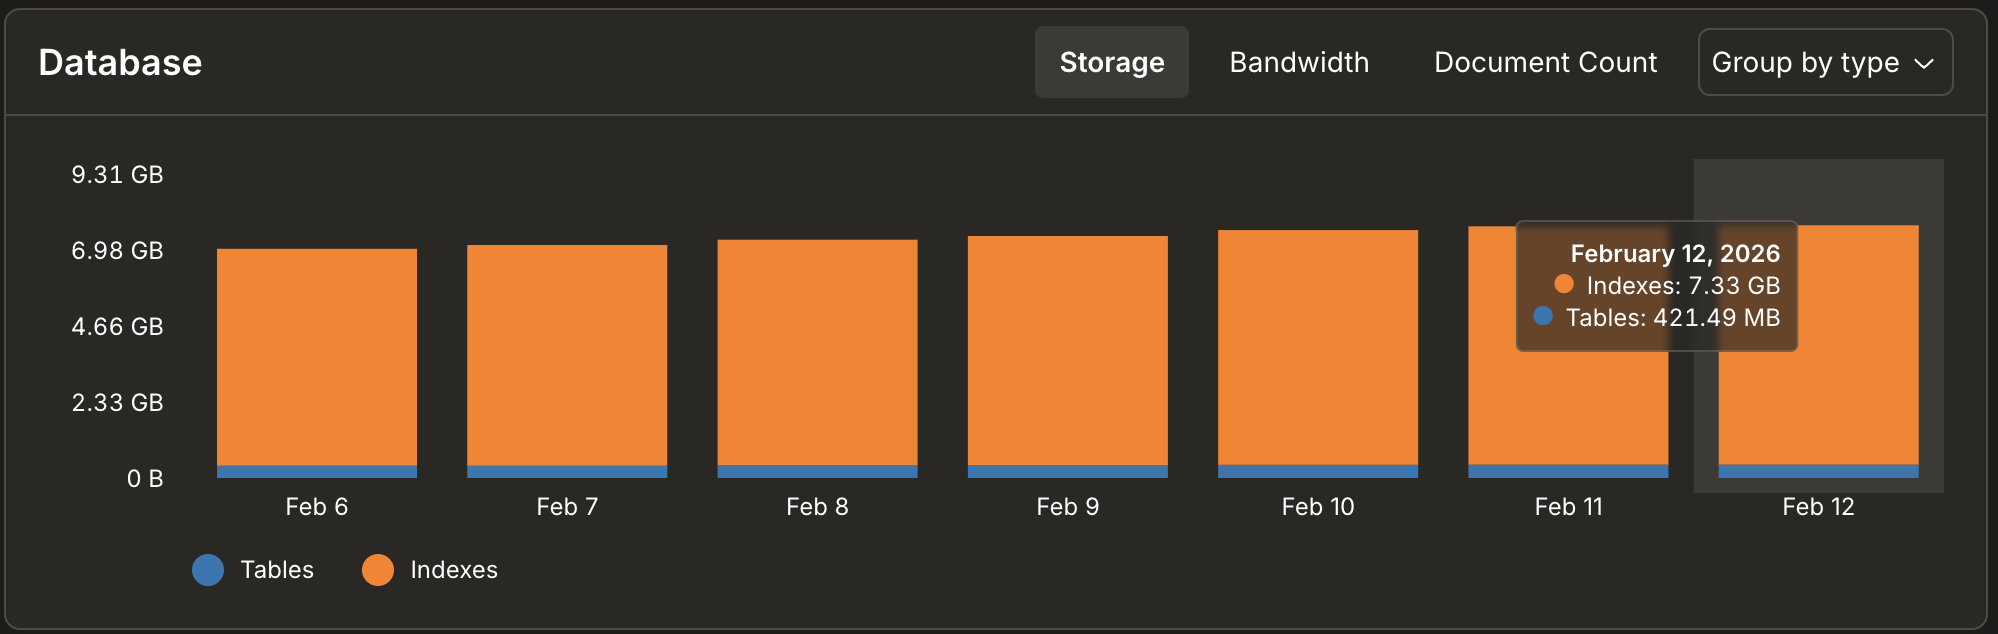
When I look at the 'Database' visual with the 'Storage' tab selected, the latest column says 7.33GB for indexes and 420MB for tables.
My question is does this graph show the accumulated database storage (in which case the 50GB would be wrong). Or, is this how much storage is used everyday and the 'Database Storage' comes from adding up usage for every single day rather than just the accumulated amount.
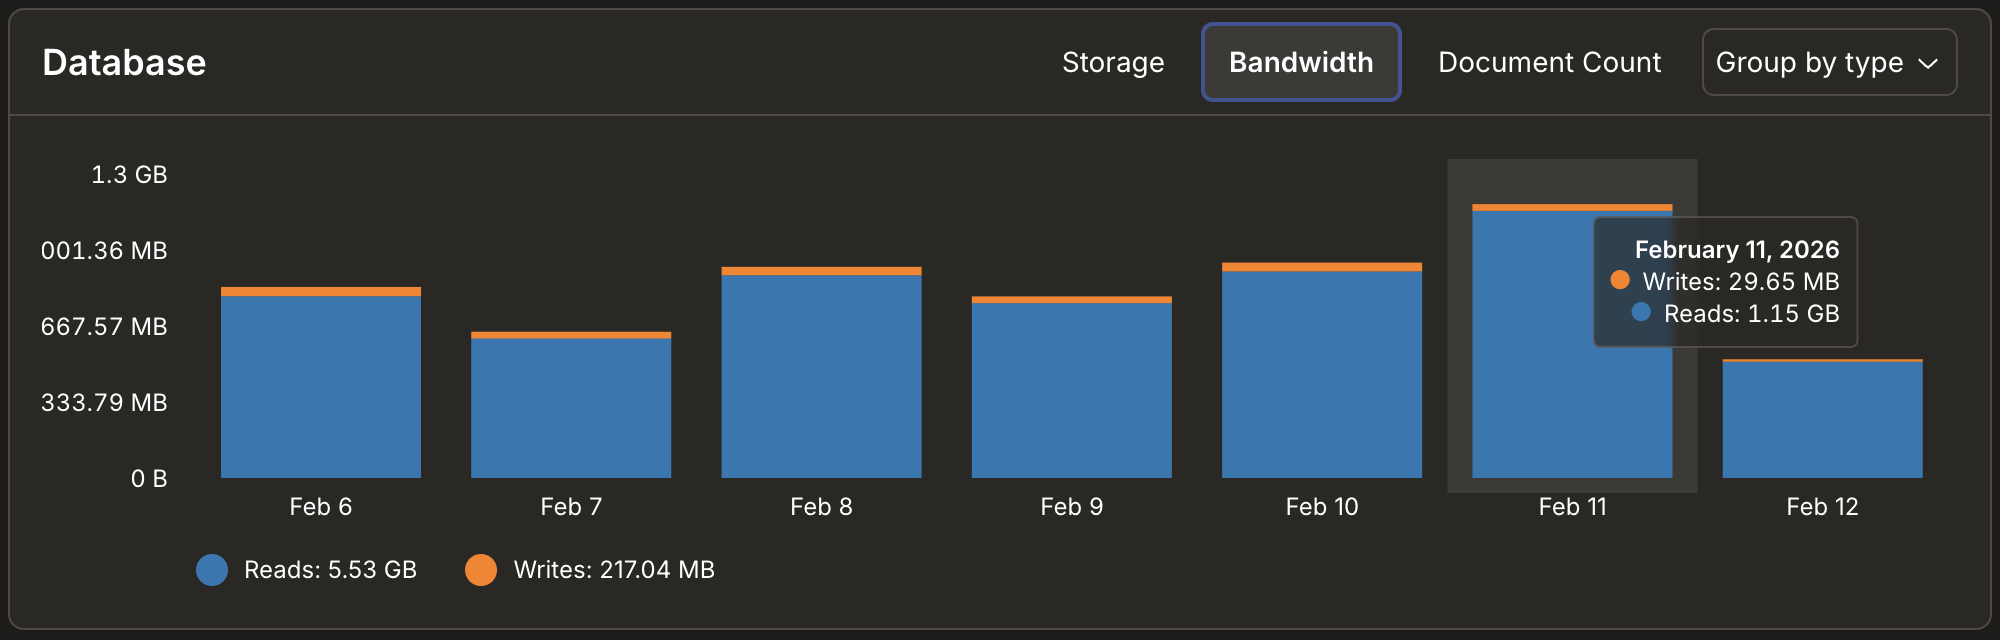
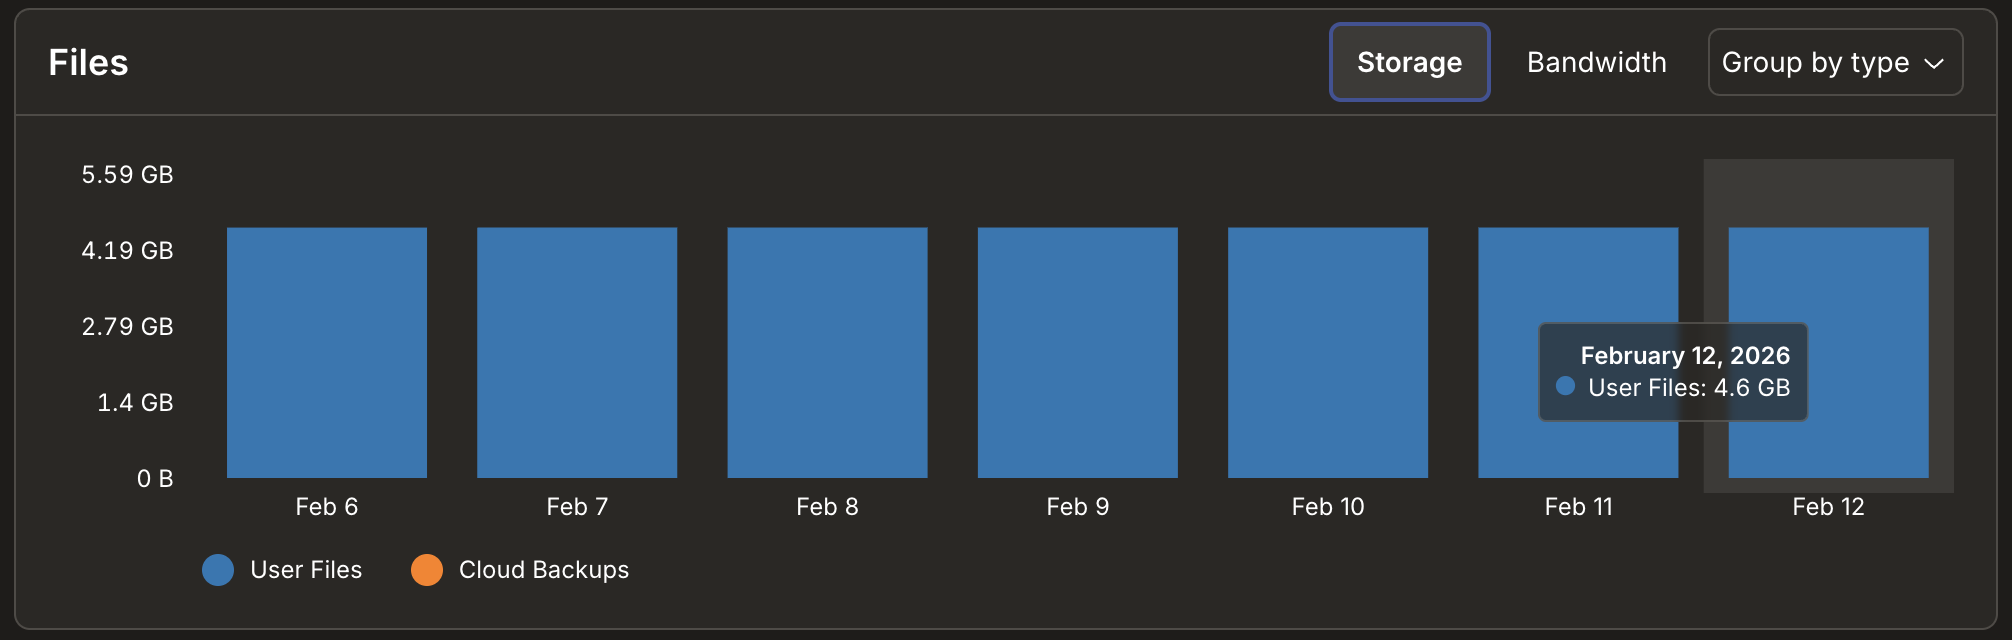
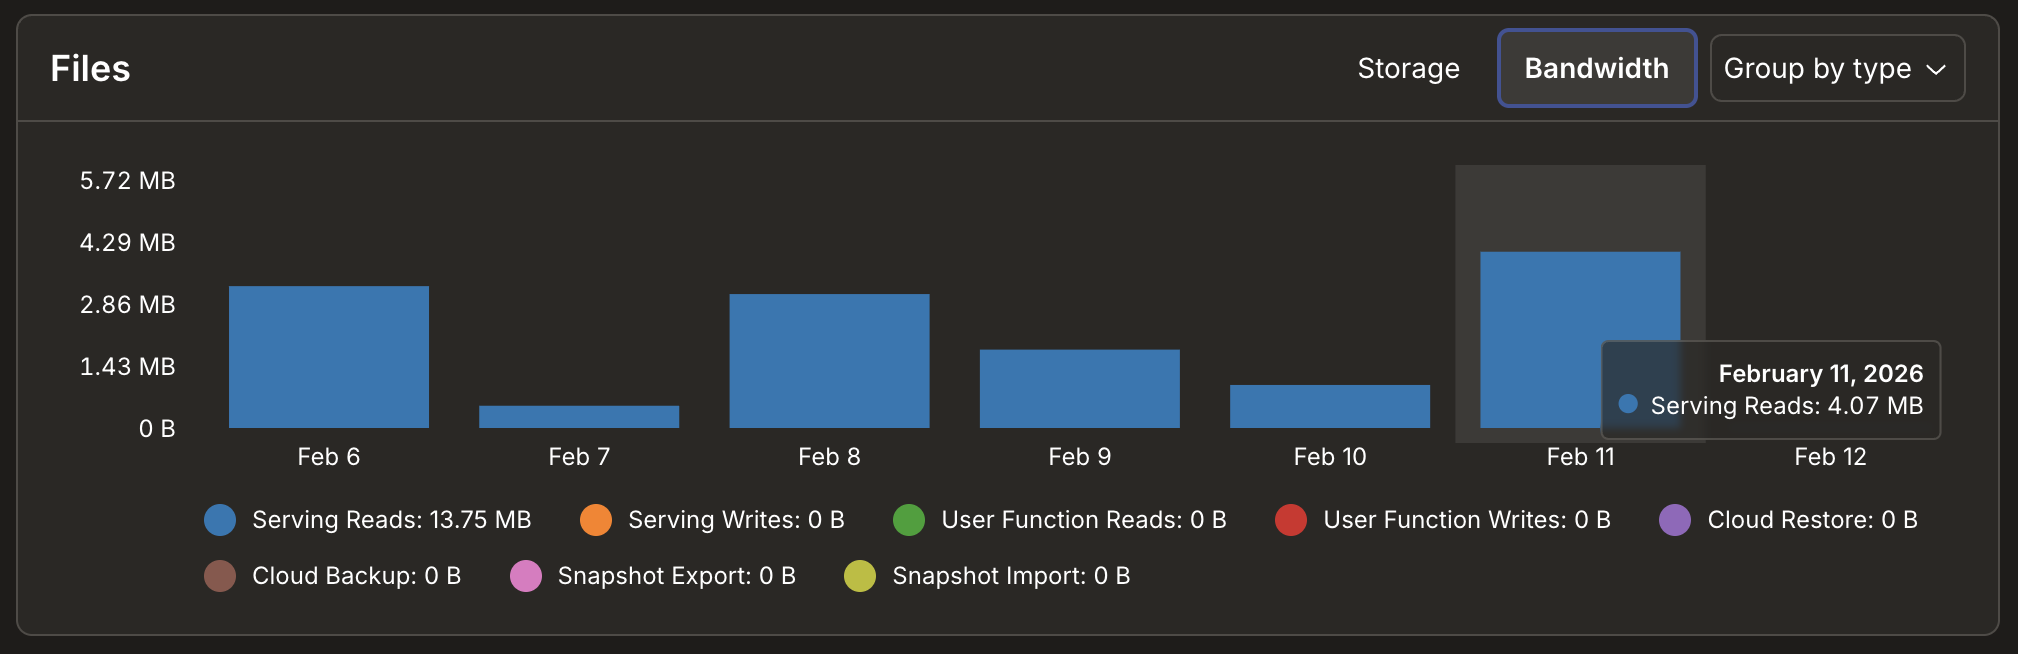
I have a similar issue with File Storage except its like 10x worse. My file bandwidth is apparently ~4.6GB even though on the visual below its like 50MB over the past 6 days. Similar with file storage, we haven't uploaded any new content at all to convex
I've attached images of these visuals. Any thoughts? Maybe I'm misinterpreting?
When I look at the 'Database' visual with the 'Storage' tab selected, the latest column says 7.33GB for indexes and 420MB for tables.
My question is does this graph show the accumulated database storage (in which case the 50GB would be wrong). Or, is this how much storage is used everyday and the 'Database Storage' comes from adding up usage for every single day rather than just the accumulated amount.
I have a similar issue with File Storage except its like 10x worse. My file bandwidth is apparently ~4.6GB even though on the visual below its like 50MB over the past 6 days. Similar with file storage, we haven't uploaded any new content at all to convex
I've attached images of these visuals. Any thoughts? Maybe I'm misinterpreting?